Funding Partners: Idaho Wheat Commission, Oregon Wheat Commission, Washington Grain Commission
By Jayne Bock| June 26th, 2018|Current Research
Project Summary
In response to interest from customers in Latin America, WMC is working to identify soft white wheat functional characteristics for use in saltine crackers. This will focus on formulation and processing adjustments to improve Soft White Wheat cracker dough properties.
Abstract
Soft white (SW) wheat is well-suited for making a range of crackers and cookies, including saltine crackers. Identifying the SW wheat flour specifications and optimal grain protein level for saltine crackers is very important for customers making procurement decisions. To identify the optimum wheat protein level, SW with varying protein content from 8.7 to 12.5 % was used to make saltine crackers. Flour solvent retention capacity (SRC), gluten and dough characteristics and cracker-baking performance were evaluated. The results showed the sodium carbonate SRC increased from 71.9 to 75.0%, sucrose SRC from 83.4 to 94.2% and lactic acid SRC from 98.0 to 113.3% as SW protein content increased from 8.7 to 12.5%. Dough was more extensible (L: 109.0-143.0 mm) and resistance to deform (P: 39-46 mm) with higher protein content from 10.5 to 12.5%. The cracker height (6.65-7.10 cm) and texture (breaking force: 1934.9-3158.2 g) gradually increased with increasing protein levels. Protein content from 10.5-11.6% had intermediate lactic acid SRC and breaking force which would be best for making the light and flaky crackers.
Introduction
Traditionally, flour mills in Latin America import soft red winter (SRW) wheat to produce flour for cookie and cracker products. However, in recent years, some of these companies have switched or considered switching to soft white (SW) wheat due to its consistent quality and superior milling characteristics.
In the 2016/17 marketing year, 86% of total SRW exports went to the combined regions of Latin America and the Caribbean, according to the commercial sales data compiled by USDA. While the percentage of total SRW exports was similar to prior years, the total tonnage dropped by 47%, with the decrease primarily in shipments to South America. That same year, exports of SW to South America increased by 84%, from 56,000 MT to 133,300 MT. SW exports to Central America and Mexico remained steady at about 198,000MT. This data suggests that SW is increasingly accepted and desired by the millers and food processors in Latin America for a number of reasons.
It has been a challenging process for some companies in the region to use SW for cracker manufacturing as it does not perform the same as SRW. U.S. Wheat Associates (USW) and PNW Wheat Commissions have sponsored two companies to attend Wheat Marketing Center (WMC)’s custom cracker courses to develop SW flour blends and optimize processing conditions to improve saltine cracker quality. Positive results were generated in the courses concerning the use of SW flour in saltine cracker production. However, as those custom courses were conducted for individual companies, the results were not published.
At the 2016 Latin American Buyers’ Conference held in Portland, WMC hosted a tour and had meetings with several customers and traders from the region. They expressed uncertainty about what protein specifications to buy to make flour for saltine crackers. WMC proposed this public research project to produce results that would be made available to all customers. The objective of this research is to identify optimum SW protein level for saltine cracker production.
Materials and Methods
Materials
This research used five composited SW wheat samples (SW8.7, SW9.6, SW10.5, SW11.6 and SW12.5) with varying protein content from 8.7-12.5% (12% mb). Each composited sample was made by blending SW varieties that grew in different Pacific Northwest regions in 2017. According to the Federal Grain Inspection Service (Portland, OR), the composited samples were U.S. Grade 1 and 2. One commercial SRW (protein content: 9.8%, 12%mb) from Ardent Mills (Denver, CO) was used as the control.
Methods
Wheat Flour Milling
Each wheat samples (15 kg) were tempered to 14.5% one day before milling. The tempered wheat samples was milled on the pilot-scale Miag Multomat Mill (Buhler, Braunschweig, Germany) at Wheat Marketing Center (Portland, OR). The feed rate was 91-98 g/min. The breaking and reduction millstreams were combined and blended together for the straight-grade flour that used for saltine cracker product in this research. The straight grade milling yields for SW8.7, SW9.6, SW10.5, SW11.6 and SW12.5 were 73.7, 74.9, 73.8, 73.3 and 71.5%, respectively.
Flour Quality Analysis
Flour moisture (Method 44-15.02), protein (Method 46-30.01), ash (Method 08-01.01) and falling number (Method 56-81.03) were analyzed according to the AACC International Approved Methods (2010). Farinograph was measured for evaluating dough mixing properties according to the AACC International Approved Method (54-21.02). The farinograph water absorption (%), peak time (min) and stability (min) were recorded. Solvent retention capacity (SRC) tests, including water SRC, sodium carbonate SRC, lactic acid SRC, and Sucrose SRC, were determined according to the AACC International Approved Methods (56-11.02). Alveograph dough test was measured following the AACC International Approved Methods (54-30.02). The P (maximum ordinate), L (abscissa at rupture) and W (deformation energy) that measure resistance of dough deformation and extension were recorded in the Alveograph. Gluten aggregation properties was measured using the GlutoPeak (Brabender GmbH&Co. KG, Duisburg, Germany) following the improved method developed by Wang et al (2018) for WW flour. WW flour sample and 0.5 mol/L Cacl2 (in total 18g) were mixed in the testing cup. The gluten was developed and then aggregated against with the mixing blade. The gluten peak maximum time (s), torque maximum (BE) and aggregation energy (GPU) were recorded. All flour quality tests were duplicate and the average and standard deviation were reported.
Saltine Cracker Making
The formulation of the saltine crackers was:
- SW flour (1000g)
- Instant yeast (3g)
- Yeast food (0.3g)
- Shortening (140g)
- Water (260g) Salt (8g)
- Baking soda (4.5-8.5g)
Instant yeast and yeast food were dissolved with water and then mixed with part of the flour (650g), sour starter, shortening and water in a Hobart mixer A-200 equipped with a double spiral mixing head at speed 1 for 3 min and at speed 2 for 2 min. The dough was placed in a plastic container and rested in a proof cabinet (30ᵒC and 85% RH) for 18h. After that, mixed salt, baking soda and the remaining flour (350g) with the dough and rested in a proof cabinet (30ᵒC and 85% RH) for 2 h. The dough was put on a pilot-scale cracker sheeting and baking line (Poolphol Engineer Ltd, Samutprakarn, Thailand). The settings for the process were:
- 1st sheeting rolls, 1.2mm gap;
- Lamination, 6 layers;
- 2nd reduction rolls, 1.4 mm gap;
- 3rd reduction rolls, 1 mm gap;
- Cutting with a rolling molder (5.12 x 4.93 cm per cracker dough piece);
- Baking (zone 1: 210ᵒC; zone 2: 230ᵒC; zone 3: 170ᵒC; and baking time: 6 min).The crackers were then cooled and stored in Ziploc bags for later quality evaluation. Production of each sample was repeated three times.
Saltine Cracker Quality Evaluation
Cracker stack height and weight were measured on ten crackers using a Vernier Caliper (Mitutoyo Manufacturing Co. Ltd., Japan). Breaking strength of crackers was determined using a texture analyzer (TA-XT, Texture Technologies Corp., Scarsdale, NY) with the three-point bending rig (Li et al 2014). Each cracker was placed between the two supports and bending blade (TA-43R). The bending blade moved downwards to break cracker and the breaking strength was recorded as the peak force when cracker broke. Pre-test, test and post-test speeds were 2.0, 3.0 and 10.0 mm/s, respectively. Each quality parameter was measured ten times and the average value and standard deviation were recorded.
Statistical Analysis
Statistical analysis was done using SAS 9.4 software (SAS Institute, Cary, NC) using one-way analyses of variance. Least significant difference (LSD) was conducted for significant difference at P<0.05.
Flour Quality
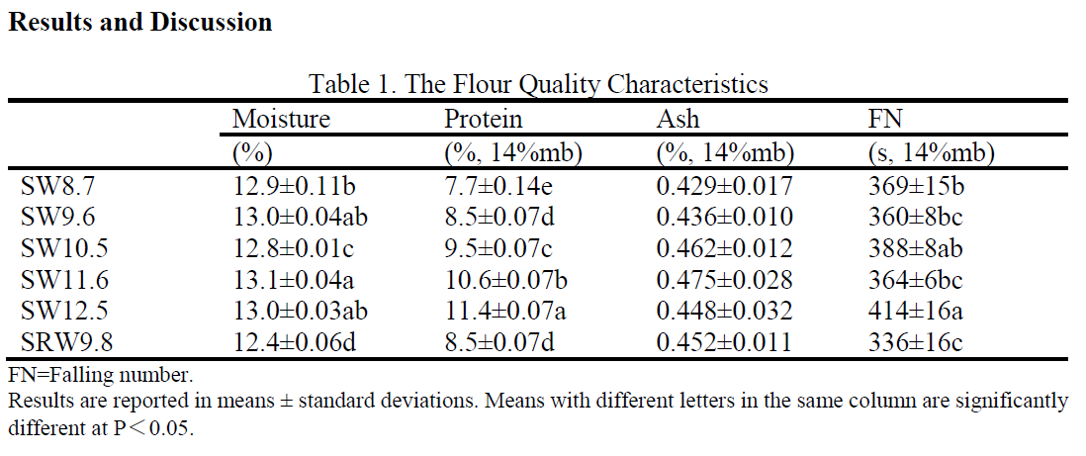
Table 1 summarizes the SW flour quality. Flour moisture ranged from 12.8-13.1% from SW8.7 to SW12.5. Flour protein was 7.7-11.4% (14% mb). Flour protein content decreases 0.9-1.1 % from the grain protein content as the bran layer is removed during milling. Flour ash was 0.429-0.475% (14% mb). Falling number was 360-414 s (14% mb) for SW and 336 s for SRW.

SRC measures the weight of each solvent held by flour after centrifugation. The water SRC was 53.9-56.9 % (14% mb) for SW8.7 to SW12.5 (Table 2). Sodium carbonate SRC were 70.3-75.0% for SW8.7 to SW12.5 and 69.3% for SRW9.8. Sodium carbonate SRC indicates the level of damaged starch in flour.
The SW had higher damaged starch than SRW. Lactic acid SRC was 98.0-113.3%. SW11.6 had high lactic acid SRC (113.3%), followed by SW12.5 (107.6%). SW8.7 and 9.6 had low lactic acid SRC (90.6-98.0%) which were close to the SRW (92.0%). Higher lactic acid SRC indicates higher glutenin level in flour. The glutenin level is one of the major components that is contributed to gluten strength. High gluten strength exhibits good oven spring, thereby producing light cracker product. Sucrose SRC was 83.4-94.2%. High sucrose SRC of SW11.6 (91.1%) and 12.5 (94.2%) indicates high percent of arabinoxylans in flour samples, as sucrose solvent allowed arabinoxylan swelling and interacted with the xylan backbone of flour arabinoxylans for high SRC (Kweon et al 2011).
The gluten performance index (GPI), the ratio of lactic acid SRC and sodium carbonate and sucrose SRCs, has been used as a predictor of overall performance of cracker flour (Li et al 2014). All SW were GPI>0.54 that showed sufficient gluten strength and good oven spring for cracker products.
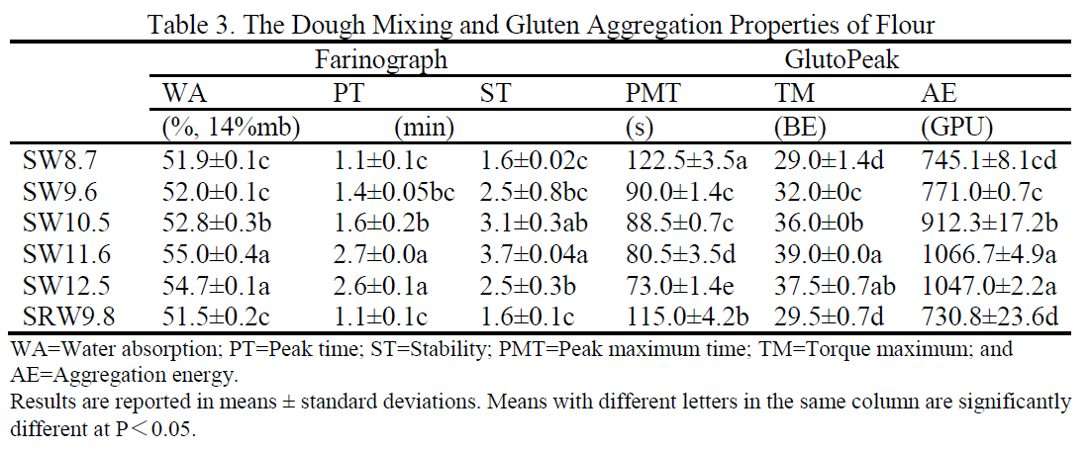
The Farinograph water absorption was 51.9-55.0% (14% mb, Table 3). Farinograph PT represents gluten development. PT was 1.1 min for SW8.7 and 2.7 min for SW11.6. PT was gradually increased as the flour protein content increased. ST is the time between arrival and departure to 500 BU line on a Farinogram.
Long ST indicates strong gluten strength. The gluten strength was observed high with SW11.6 (ST: 3.7 min) and low with SW8.7 and SRW9.8 (ST:1.6 min for both). GlutoPeak PT was 122.5 s for SW8.7 and decreased to 73.0 s for SW12.5. TM was 29.0 BE for SW8.7 and increased to 39.0-37.5 BE for SW11.6 and 12.5.
Likewise, AE was observed to increase from SW8.7 to 12.5. As flour protein content increased, the PT was decreased and TM and AE were increased.
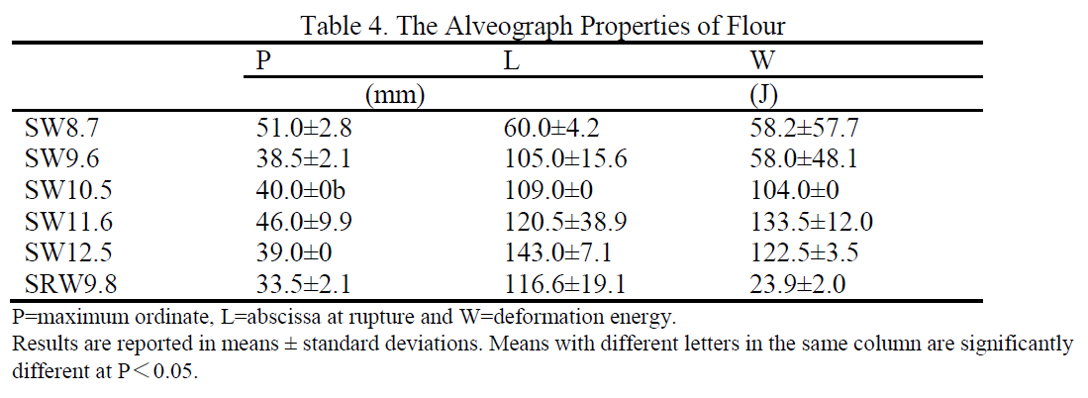
The Alveograph was used to evaluate the resistance of dough deformation and extensibility. P was high for SW8.7 (51.0 mm) and low for SW12.5 (39.0 mm, Table 4).
As protein content increased, the resistance of dough deformation increased. P values ranging from 30-40 mm were desirable for non-blistering and good spreading of cracker product (Slade et al 1994). L was high for SW12.5 (143.0 mm), and low for SW8.7 (60.0 mm). The dough extensibility increased with flour protein content. W was high for SW11.6 and 12.5 (122.5-133.5 J), indicating high deformation energy from their dough strength. L>90 mm and W of 75-105 J results predicted good dough extensibility and puffing strength (Slade et al 1994).

Cracker Quality
Cracker dough weight was 41.4-47.2 g for SW8.7 to 12.5 (Table 5). When the dough entered to the oven, the water vaporized on the surface and the moist interior started to puff into layer of crackers. After baking, the cracker moisture was 2.0-2.1% for SW flours. Cracker stacked height was 6.65-7.10 cm from SW8.7 to 12.5 (Fig. 1a). SRW9.8 had low cracker height (6.53 cm).
The cracker stacked height was increased as the increasing protein content. The higher protein content (11.6-12.5%) of SW flour showed stronger gluten (lactic acid SRC: 107.6-113.3%), which resulted in higher cracker height from the better puffing and bubbling during baking. SW stacked weight and ratio of stacked weight and dough weight were close to SRW. They were not significantly but slightly increasing as the SW protein content increased. The breaking force was increased from 1934.9 to 3158.2 g from SW8.7 to 12.5.
The breaking force was associated with cracker height and weight (Wang et al 2016). Higher cracker height and weight might make the cracker harder to break.
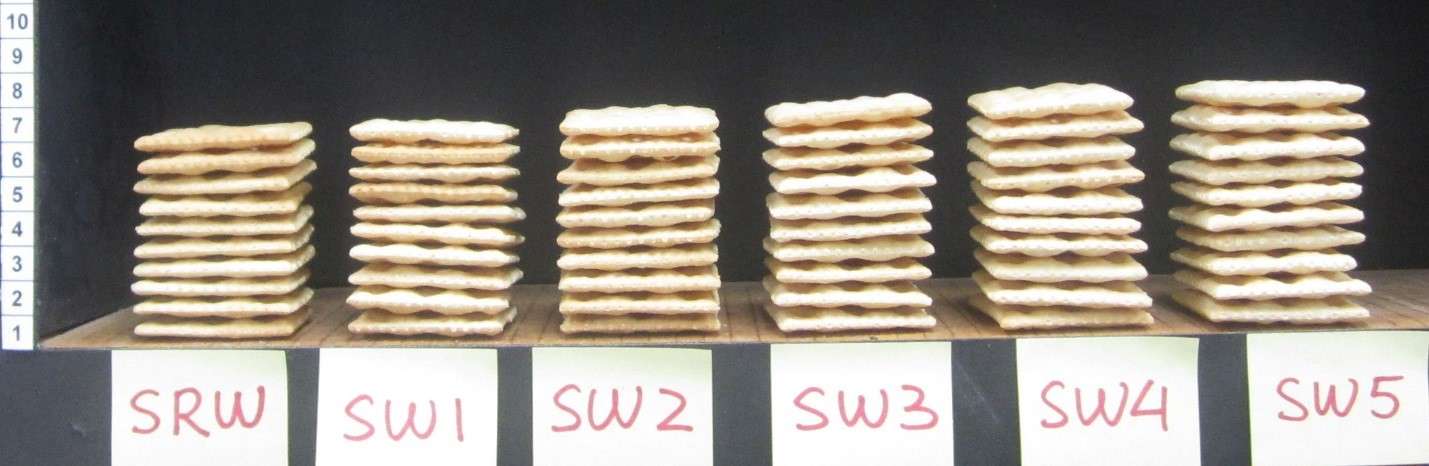
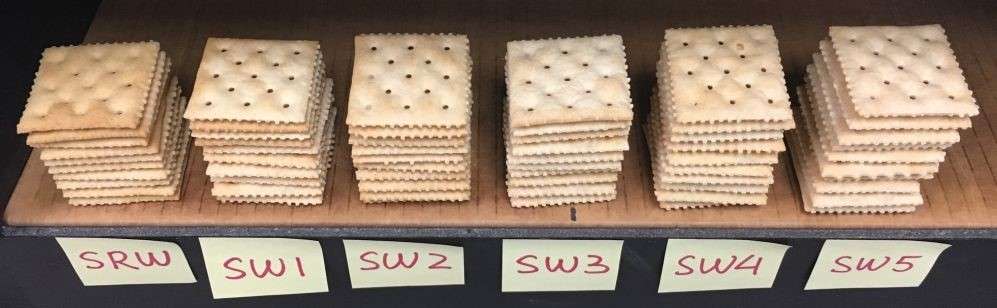
Fig 1. The appearance of stacked crackers.
SRW=SRW9.8, SW1=SW8.7, SW2=SW9.6, SW3=10.5, SW4=SW11.6 and SW5=SW12.5.
About the flour specifications for cracker production, low sodium carbonate and sucrose SRCs were preferred as less water was added during mixing. High water often requires prolonged baking time for obtaining low moisture content in the final product. It subsequently increases the energy input and production cost. Also, high water content could increase the difficulty of breaking the cracker, which causes undesirable mouthfeel. The lactic acid SRC indicates the property of gluten strength and high value for good dough extension and snap-back during machining is favored. Kweon et al (2011) summarized the SRC values for good quality of cracker when using the SRW blends. The sodium carbonate, sucrose, lactic acid and water SRCs were ≤72, ≤96, ≥100 and ≤57%, respectively. SW10.5 to 12.5 showed similar SRC values in the target ranges. Their cracker heights were as high as expected due to the lactic acid SRC, which mainly affected the puffing during baking. The appearance of the crackers was good (Fig. 1b).
As the protein content increased from SW10.5 to 12.5, the breaking force was gradually increased from 2172.9 to 3158.2 g. Higher SW protein content could improve the cracker baking performance and texture. However, saltine crackers are favored by flaky texture (Delcour and Hoseney 2000). SW12.5 produced crackers with hard texture that decreases the desirability of the cracker end product. SW10.5 and 11.6 achieves the flaky quality target, as indicated by their intermediate breaking force (2172.9-2473.8 g).
Conclusions
Five SW samples with varying protein contents were evaluated for saltine cracker production. As SW protein increased, lactic acid SRC, dough mixing and GlutoPeak aggregation properties increased. For the cracker quality, cracker height and breaking force strength increased from SW8.7 to 12.5. SW10.5 and 11.6 had intermediate lactic acid SRC and cracker breaking force, which are best for making the light and flaky crackers. The medium protein also had acceptable height results.
This project focused on protein levels as the main variable. Many other variables such as wheat gluten functionality, leavening agents, dough mixing and baking profile would affect the cracker quality. The selection of formulation and processing would achieve quality control of cracker product and make desirable product.
Acknowledgements
Wheat Marketing Center thanks Idaho Wheat Commission, Oregon Wheat Commission and Washington Grain Commission for sponsoring this research project.
Research Team
Gary G. Hou, Lingzhu Deng, Min Xu, Bon Lee, Tina Tran, Kin Wong
Wheat Marketing Center, Portland, Oregon, U.S.A
References
American Association of Cereal Chemists International. 2010. Approved Methods of Analysis, 11th Ed. Methods (44-15.02), (46-30.01), (08-01.01), (56-81.03), (54-21.02), (56-11.02) and (54-30.02). American Association of Cereal Chemists International: St. Paul, MN.
Delcour, J. A., and Hoseney, R. C. 2000. Chapter 13. Chemically-leavened products. pp: 320-356 in Principles of Cereal Science and Technology, eds II. American Association of Cereal Chemists International: St. Paul, MN.
Kweon, M., Slade, L., and Levine, H. 2011. Solvent retention capacity (SRC) testing of wheat flour: principles and value in predicting flour functionality in different wheat-based food processes and in wheat breeding-a review. Cereal Chem. 88:537-552.
Li, J., Hou, G. G., Chen, Z., Chung, A-L., and Gehring, K. 2014. Studying the effects of whole-wheat flour on the rheological properties and the quality attributes of whole-wheat saltine cracker using SRC, Alveograph, rheometer and NMR technique. LWT-Food Sci Tech. 55:43-50.
Slade, L., Levine, H., Craig, S., and Arciszewski, H. 1994. Reducing checking in crackers with pentosanase. United States Patent. No. 5362502.
Wang, N., Hou, G. G., Kweon, M., and Lee, B. 2016. Effects of particles size on the properties of whole-grain soft wheat flour and its cracker baking performance. J. Cereal Sci. 69:187-193.
Wang, J., Hou, G. G., Liu, T., Wang, N., and Bock, J. 2018. GlutoPeak method improvement for gluten aggregation measurement of whole-wheat flour. LWT-Food Sci Tech. 90:8-14.
Contact Dr. Jayne Bock at 503-295-0823 or jbock@wmcinc.org for more information or to discuss new research projects.